See other “How to”
Liver evaluation through combi-elastography
Description :
The new generation of ultrasound systems includes thecombined use of elastographic techniques (Combi-Elasto) and a function for the quantitative assessment of steatosis (ATT), thus allowing:
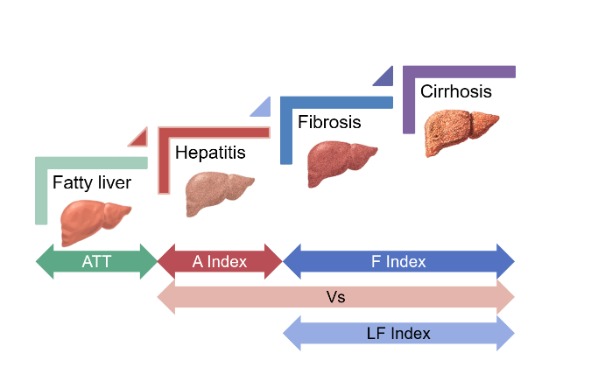
- an extensive evaluation of diffuse parenchymal liver diseases, with the improvement of differential diagnosis between various liver pathologies (hepatic steatosis, hepatitis, fibrosis and liver cirrhosis)
- to assess the chronological progression of liver inflammation and fibrosis with greater accuracy (Figure 1-3)
ATT index value (attenuation measurement function) – Ultrasound attenuation gets higher as fat tissue increases. As such, it helps to assess hepatic fatty infiltration by quantifying the attenuation degree of the ultrasound propagation, which is not affected by liver inflammation and fibrosis.
Combi-Elasto allows the assessment of liver fibrosis degree with increased accuracy through the simultaneous use of two non-invasive, complementary methods, different from the technical point of view, with distinct possibilities and limitations – point shear wave elastography (pSWE – point shear wave), respectively strain elastography (RTE – real time elastography). The main characteristics of each method are represented in the table below.
Although a simple method, frequently used in medical practice, pSWE elastography has the disadvantage of being influenced by inflammation, cholestasis and liver congestion, the values of the quantitative parameters obtained this way being falsely increased in these patients. On the contrary, strain elastography (RTE) is not influenced by the conditions mentioned above. By integrative analysis of the quantitative parameters obtained by both methods, 2 new parameters are obtained: A (inflammation-related index) and F (fibrosis index). Recent studies have demonstrated their superiority in the correct evaluation of liver inflammation and fibrosis, compared to each method separately (pSWE, RTE).
| Elastographic technique |
Strain – Real time elastography (RTE) |
Point shear-wave elastography (pSWE) |
| – It is based on the fact that changes in the structure or composition of a tissue are associated with changes in their elasticity. | – It consists in applying tissue pressure (internal compression and relaxation given by the heart / vessels movements) and measuring the tissue displacement (semi-quantitative analysis). | – The stimulus deforming the tissue is an acoustic “push pulse” generated by the transducer, measuring the speed of shear-waves in the tissues (quantitative analysis). |
| – Quantitative parameters analyzed:
|
– Elastogram represents a colored map that highlights the different types of hardness. – Analysis of the histograms and calculation of the: LF index (liver fibrosis index). |
– Vs (m/s): propagation velocity – E (kPa): elasticity index – VsN: reliability index (to give an objective evaluation on the Vs/E |
GOOD TO KNOW
– When performing strain-type elastography (RTE), the automatic compression of the liver determined by the heartbeat / vessel pulsations is detected, thus not requiring the application of an external pressure -> simplifying the execution technique.
- It is possible to assess the quality of the procedure – RTE – through the graphic representation of the liver compression given by the heartbeat (strain graph).
- Integration of the auto-frame selection function, with the automatic selection of optimal frames represented by the negative peaks on the strain graph.
– Through integrated analysis of the reliability markers (for p SWE): VsN and IQR/M, the cause of errors in the measurements obtained can be assessed:
- Low values of VsN are caused by: shear wave propagation through vessels, hypoechoic regions (shadows) and body movement.
- Thus, in the case of variable IQR/M values, accompanied by increased values of VsN: the variations can be considered related to changes in the liver parenchyma in various pathologies (disease related).